What does the Japanese EC Market Look Like?

In this article, we will explain the growth rate trends of the Japanese EC market. Please read this article to the end if you are already involved in the EC industry or if you are planning to enter the industry in the future.

What is the EC Market?
EC Market Size, Transition, and Growth Rate in Japan in 2021

Nowadays, we often hear such phrases as “The EC market is expanding year by year! The future is the age of EC” and so on. But what is the actual situation?

Let’s take a look at the latest domestic EC market from the data released by the Ministry of Economy, Trade, and Industry in July 2021.

Source: Results of Market Research on eCommerce

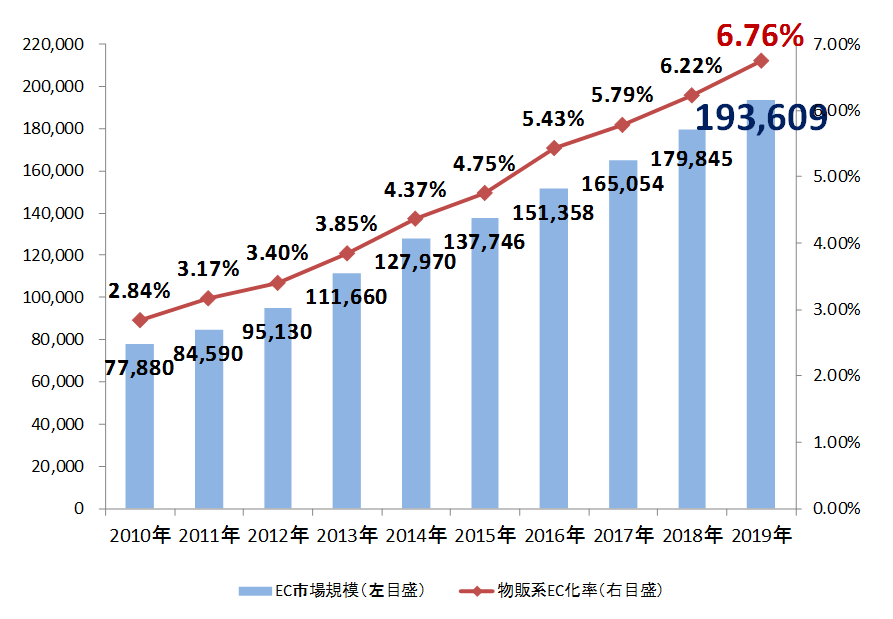
The BtoC-EC market, represented by EC malls such as Amazon and Rakuten Ichiba and online shops, has been expanding for the ninth consecutive year. The growth rate is also increasing every year.

An online shop where you can shopanytime, anywhere” matches the diversifying lives of consumers. The number of new entrants is increasing, and competition in the market is also intensifying year by year.

Among the people involved in buying and selling in the EC market, the percentage of people who use smartphones instead of PCs is increasing year by year.

The graph below shows the changes in the market size via smartphones over the last five years from the “International Economic Research Project (Market Research on Electronic Commerce) on the Economic Growth Strategy of the First Year of Reiwa” published by the Ministry of Economy, Trade, and Industry (METI).

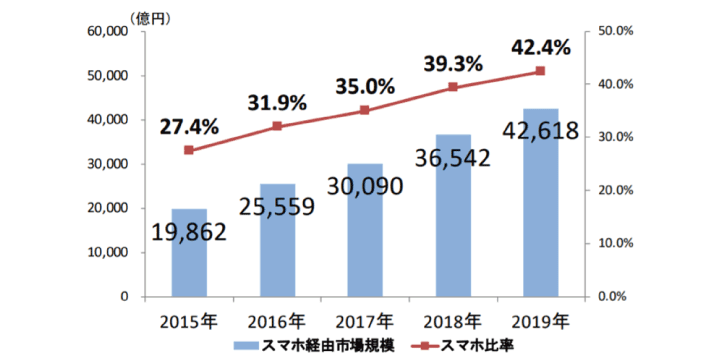
While the percentage of users via smartphones was less than 30% in 2015, it is close to half by 2019.

The reasons for this growth are the convenience of smartphone apps and the development of marketing measures using smartphones (SNS, push notifications, etc.). In addition to this, the number of smartphone users, regardless of generation, is increasing.


2018

2019

Growth rate

Product Sales field

9.3 trillion yen

(EC conversion rate 6.22%)

10.05 trillion yen

(EC rate 6.76%)

8.09%

Service Fields

6.65 trillion yen

7.17 trillion yen

7.82%

Digital field

2.04 trillion yen

2.14 trillion yen

5.11%

Total

17.98 trillion yen

19.36 trillion yen

7.65%

Source: Summarized the results of market research on e-commerce

Next, let’s take a look at the data for each of the three fields: product sales, services, and digital. The market size of each field is shown in the table above.

All three fields are expanding, with the highest growth rate being in product sales e-commerce. In the sales industry, marketing that utilizes both real (real stores) and online (EC) such as O2O and omnichannel has been conspicuous in recent years, and the number of new stores entering EC is increasing.

Among EC product sales, the category with the highest growth rate from last year was “household appliances, audio/visual equipment, and PC/peripheral equipment, etc.”. This category accounted for 1.82 trillion yen, 110.76% of last year’s total, and the EC rate for the market as a whole was also high at 32.75%.

In addition, “food, beverages, alcoholic beverages” at 1.82 trillion yen, “books, video/music software” at 1.30 trillion yen, “life miscellaneous goods, furniture, interiors” at 1.74 trillion yen, and “clothing and accessories, etc.” at 1.91 trillion yen.

Category

Elongation Rate

Food and confectionery

173.86%

Kids / Baby / Maternity

171.06%

Toys, Hobby & Game

165.01%

Looking at stores on the e-commerce site building service MakeShop, the largest growth rates from 2019 to 2020 were in “food and confectionery,” “kids, baby, and maternity,” and “toys, hobbies, and games.

This can be attributed to the changing lifestyles of the coronavirus. This is probably because the number of people buying groceries on EC sites has increased due to the self-restraint of restaurants and shortened business hours. It is also assumed that demand for kids’ products and toys increased as people spent more time with their families.

 (Compare the distribution value from January 1 to September 30, 2019, and January 1 to September 30, 2020, for each product category.

Will it Still Grow? Future Growth Forecast of EC Market and Benefits of E-Commerce

The EC market is showing remarkable growth in various fields, but the rate of EC conversion to the entire market is only 6.76% even for product sales EC, which is showing a remarkable expansion trend.

 By global standards, for example, the EC rate in the U.S. is expected to reach 13.6% by 2021, so there is still room for growth in the future.

 As for data, the Nomura Research Institute’s “IT Navigator 2020,” published in 2019, calculates that the EC market will be worth 27.8 trillion yen in 2025. 

 Furthermore, the omnichannel commerce market, which includes physical stores, is expected to increase from 54.4 trillion yen in 2018 to 80.6 trillion yen in 2025. In 2020, the coronavirus caused major changes in the economic activities of the society as a whole, including voluntary restraint from going out and shorter hours at retail stores and restaurants. In such a situation, online shopping became the mainstay for both consumers who could not go out and businesses that could not open their stores. The number of businesses opening new stores increased, providing an unexpected tailwind for the shift to e-commerce.

 EC sales have less fixed costs such as rent than physical stores and can be started at a lower risk. It also has many advantages, such as the ability to expand sales channels without time and location constraints, and the ability to send customers to actual stores.

Rapidly Growing Cross-Border EC; The State of E-Commerce Around the World

As mentioned above, the growth rate of the global EC market is even greater than in Japan. As of 2018, the global EC market size is 313 trillion yen. That was 123.3% compared to last year.

The Asia-Pacific region accounts for a particularly large share of the total, at 61% total, or 190 trillion yen. By country, China leads the way, followed by the United States and the United Kingdom, with China accounting for about 52% of the EC market.


Country

Cross-border EC purchase amount

Growth rate

Japan

317.5 billion yen

14.8%

USA

1.557 trillion yen

11.8%

China

3.665 trillion yen

12.3%

Source: Summarized the results of market research on e-commerce

Another trend that should not be overlooked is the rise of cross-border EC. The table above shows data on the value of cross-border EC purchases and growth rates for Japan, the U.S., and China in FY2019.

In the BtoC-EC market, China and the U.S. are the two main trading partners of Japan. In particular, the transaction value with China is growing remarkably year by year. The number of businesses in Japan that challenge cross-border EC is increasing every year. 

Cross-border e-commerce has the advantage of expanding sales channels, as it requires less investment than setting up a physical store outside of Japan, and allows you to promote your products and services to overseas consumers.

Furthermore, if you have a physical store in Japan, it will also appeal to tourists visiting Japan.

EC Market Sales Ranking

Click here or here to read more about this topic!

About EC Mall Sales Ranking in Japan

Ranking

Name

Amount of Sales

1st place

Rakuten

3.9 trillion yen

2nd place

Amazon Japan

3.42 trillion yen (estimated)

3rd place

Yahoo! Shopping

890 billion

Let’s look at the figures from EC malls, which are well-known and have large transaction amounts. (Based on in-house research using information from each company’s website and IR, etc., as of October 2020)

Sales Ranking of Domestic E-Commerce Sites

Ranking

Name

Amount of Sales

First place

Amazon Japan

1.744 trillion yen

2nd place

Yodobashi Camera

138.6 billion yen

3rd place

ZOZO

125.5 billion yen

Next, let’s look at the sales ranking of domestic EC sites along with their numbers.

Source here. 

Summary

More than 20 years have passed since the opening of Rakuten Ichiba in 1997.

The scale of the market is still expanding. It is not limited to the sale of goods, but has also diversified into other forms, such as the rise of video and music subscription distribution services and online reservation sites for travel and restaurants.

Behind this trend lies the transformation of economic activities in society as a whole and the diversification of consumption styles themselves.

After 2020, demand for e-commerce is has grow even more because of the corona virus. Keep a close eye on market trends both domestically and internationally.