

First at the top of the list is Rakuten Ichiba, the pioneer of e-commerce sales in Japan.
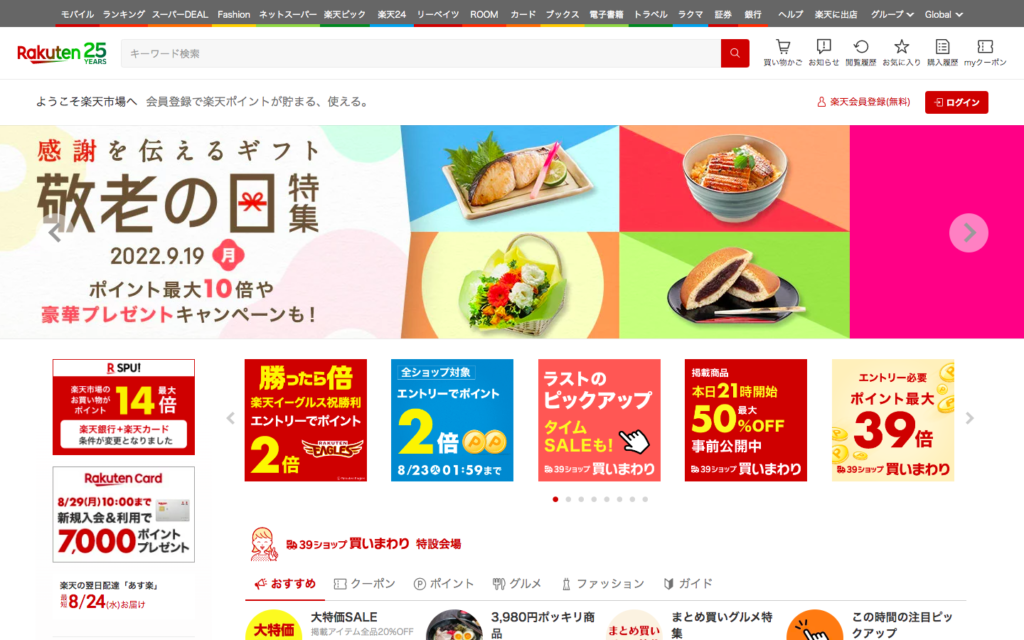 The key feature of Rakuten Ichiba is the linkage of the group’s services, such as Rakuten Card, Rakuten Travel, and Rakuten Mobile. The combination of these services, which are offered in a variety of fields, has enabled Rakuten Ichiba to successfully retain its customers as Rakuten users in a comprehensive manner.
In particular, Rakuten Points, which can be accumulated through the use of each service, are key. Of course, a high percentage of the points can be redeemed for purchases on Rakuten Ichiba, and the accumulated points can be used to purchase products.
Another feature at Rakuten Ichiba is the introduction of the free shipping line, which offers free shipping for purchases of 3,980 yen. This was a measure to improve usability and attract more customers, but it was controversial because of the backlash from some of the stores that opened.
In addition, Rakuten Ichiba also includes the total distribution amount of flea market apps and Rakuma, which are linked services. Therefore, if you compare only the sales at the mall, it is thought that Amazon Japan will be better off.
Next in second place was Amazon, which has a large market share around the world. Unlike Rakuten Ichiba, it is a marketplace-type e-commerce mall where each company and brand sells one item at a time.
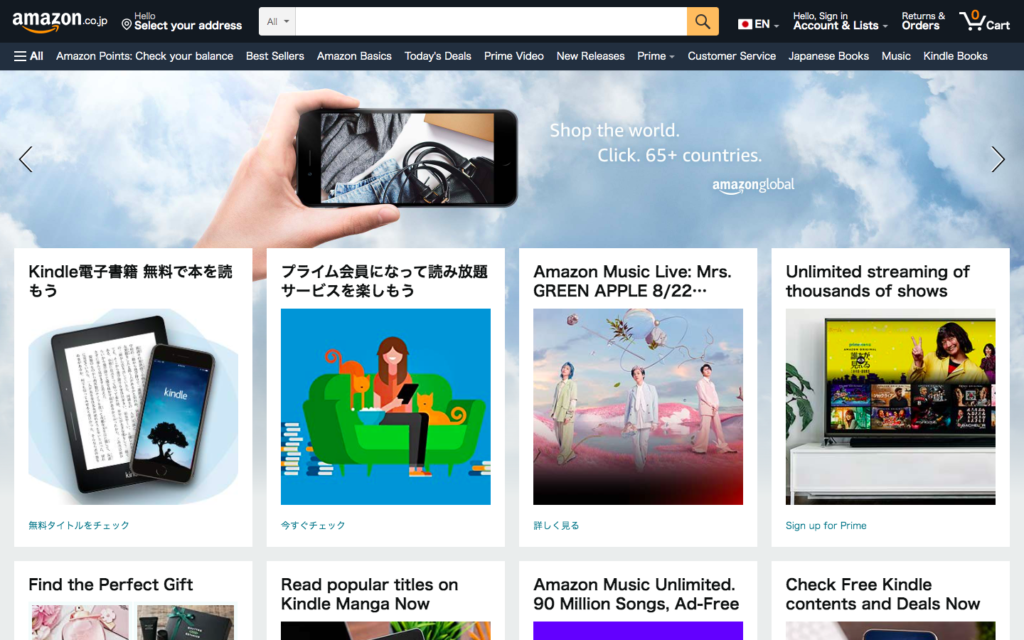 Amazon’s Prime service is helping to create fans. The membership fee is 500 yen per month (including tax) or 4,900 yen per year (including tax), and members receive a variety of membership benefits, including free express delivery and video subscriptions.
Amazon is expanding its influence to the real world, such as opening Amazon GO, an unmanned cash register in the United States. Further progress can be expected in Japan in the future as well.
Third place is Yahoo! Shopping. The distribution amount was 890.1 billion yen.
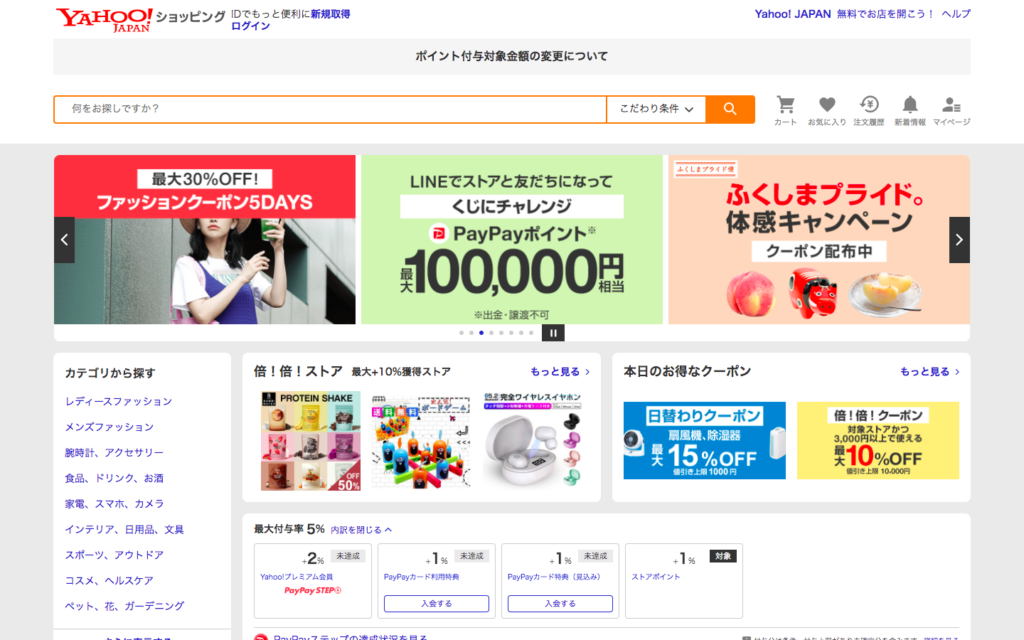 In Japan, Rakuten, Amazon, and Yahoo! are often said to be the top three retailers, but Yahoo! Japan wants to overcome the top two retailers but is having a hard time catching up. That’s why Yahoo! Japan acquired ZOZO, the operator of ZOZO Town, a fashion e-commerce store.
In addition, ZOZO is aiming to retain users by linking up with PayPay, a cashless payment system, and allowing users to earn points.
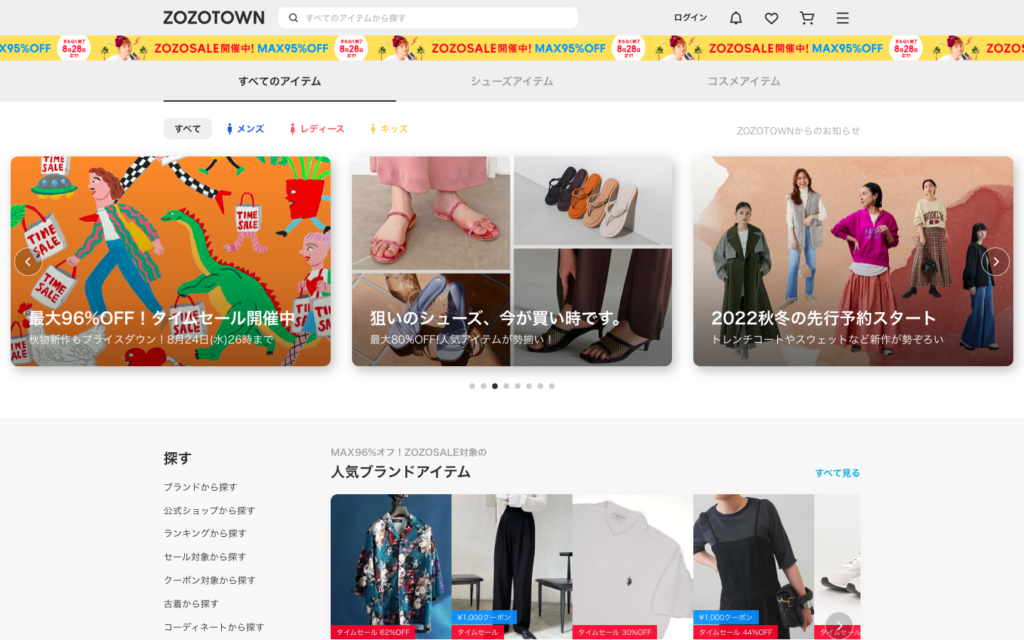 In 4th place, ZOZOTOWN is an e-commerce mall specializing in apparel. Although its distribution value is lower than the top three sites, it is quite impressive that it has made it to this ranking as a stand-alone fashion e-commerce mall, because those sites were general e-commerce malls.
As mentioned above, ZOZO was acquired by Yahoo! In this vein, ZOZOTOWN will open a store in the PayPay mall opened for Yahoo! and Softbank users in the fall of 2019.
This was ZOZOTOWN’s first store opening in an external mall, and this series of moves garnered a great deal of attention.
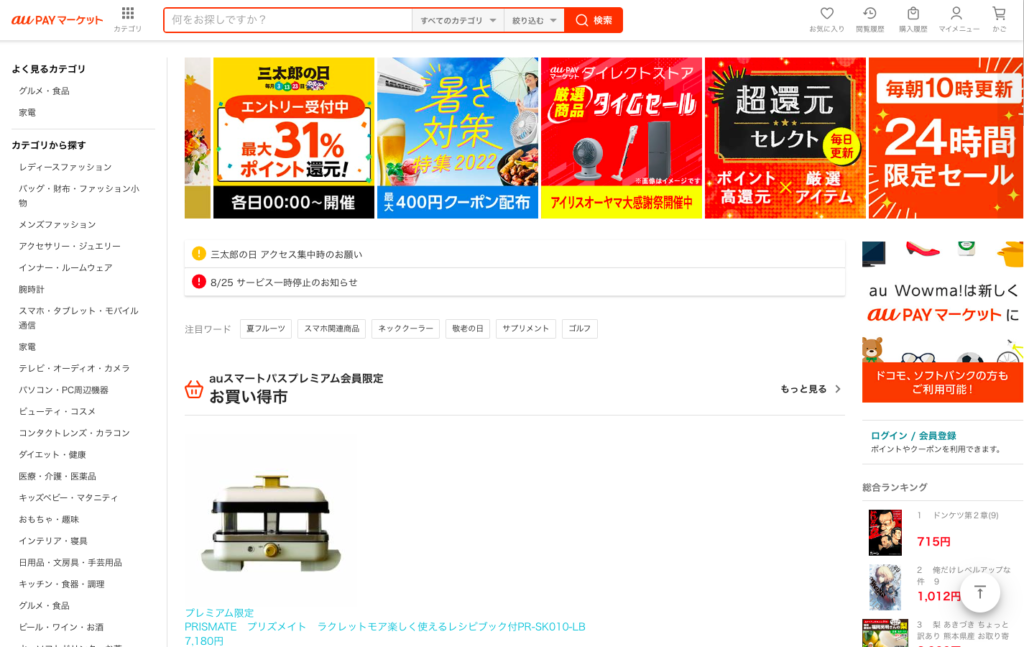 KDDI operates Wowma!, which mainly targets au users.
Note that the name has been changed to “au PAY Market” since May 2020, following the change of the name of au’s payment and EC service to “au PAY”. This EC mall is strong in fashion, home appliances, daily necessities, cosmetics, and gourmet foods.